

Screenshot Tours
A quick walk-through at the simple-slick-DIY GUI and usage scenarios.
Chart types available
Single-Series


Multi-Series


Combination


Stacked


Scroll-Charts


Creating your first delightful chart
-
 Step 1
-
 Step 2
-
 Step 3
-
 Step 4


Customizing your charts
-
 Chart data
-
 Titles
-
 Number format
-
 Customization


Chart data customization
-
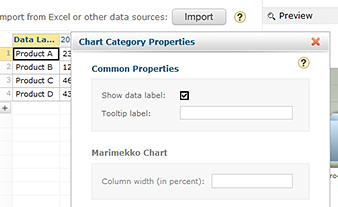 Chart category properties
-
 Chart data plot properties
-
 Chart series properties


Connecting to multiple excel files
-
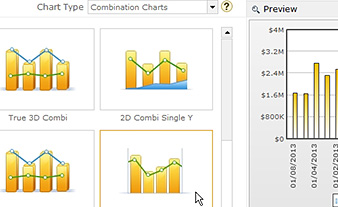 Selecting combination chart
-
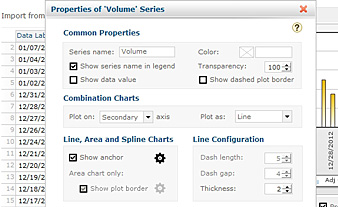 Changing dataplot for volume as line
-
 Select multiple excel files
-
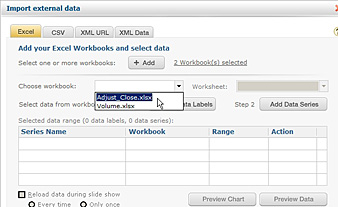 Select file to add data
-
 Select worksheet
-
 Select data range
-
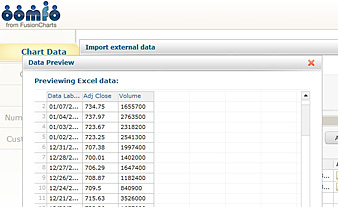 View selected data
-
 Preview chart


Charts created in oomfo
-
 Column chart
-
 Interactive legend
-
 Editable charts
-
 Line chart
-
 Marimekko chart
-
 Pareto chart
-
 Pie chart
-
 Pie chart 2
-
 Tooltips
-
 True 3D chart
-
 Waterfall chart
-
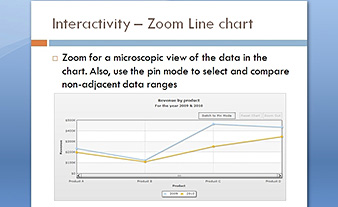 Zoom line chart


